Benchmarks
Benchmarks
This page points to measured results and to the commands that reproduce them. Use it before you quote a number or plan capacity. You get the method, the limits, and the raw data.
flowchart LR Micro["microbench in memory"] -- "covers" --> Func["one function"] Suite["suite over sockets"] -- "covers" --> Net["full broker path"] Net -- "writes" --> Rep["report + raw lines"] Rep -- "backs" --> Quote["quoted number"]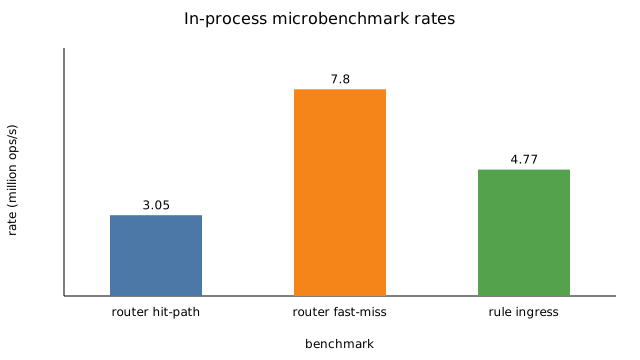
Source: docs/_data/microbench.json. The script docs/_tools/render_charts.py draws the chart. The values come from BENCHMARKS.md and crates/broker-node/benches/broker_throughput.rs.
| Test | Rate | Unit |
|---|---|---|
| Router hit-path | 3.05 | million lookups/s |
| Router fast-miss | 7.80 | million lookups/s |
| Rule engine ingress | 4.77 | million events/s |
The rates are single-threaded and in memory. They change with the hardware. They are not network values. They are in-process lookup and filter rates, not rates over the network.
Broker comparison
The README compares brokers at 1 CPU and 1 GB. It states the method, the limits and the raw data. Read it before you quote a number. The method, the tool, and the raw results live in benchmark/. See Sizing for the sustained rows.
Microbenchmarks
The router and rule engine microbenchmarks measure one function in one thread, in memory. They are not network values. They change with the hardware. Run them on your hardware:
# Slow: runs release benchmarks. The example test does not run it.cargo test --release --bench broker_throughput -- --nocaptureThe source is crates/broker-node/benches/broker_throughput.rs. The method is in BENCHMARKS.md. End-to-end loopback results live in benchmark_suite/.
Suite method
The suite in benchmark/suite measures one broker on a fixed budget over sockets. It pins 4 cores and bounded memory to the broker. It runs load generators on other cores. It uses 128 B payloads unless a scenario says otherwise. Full detail lives in benchmark/suite/README.md.
- Each scenario starts a fresh broker in a container with 4 pinned cores and bounded memory.
- Subscribers connect first and stay for all steps. Each step starts new publishers.
- A step lasts 300 s by default. The first 60 s stay out of the averages.
- Load numbers come from the counters of the broker itself (
GET /api/v5/metrics). The publish counter of the generator counts each publish twice, so the suite never uses it. The suite subtracts the probe traffic (1000 msg/s in and out). - A latency probe on its own core sends 1000 msg/s and records end-to-end latency under the main load.
- A step passes on delivery of 90 percent or more, a live broker, no generator limit flag, level memory, level p99 latency, and a drain below 30 s.
| Suite scenario | Content |
|---|---|
s1-qos0, s1-qos1, s1-qos2 | 1000 publishers, 1000 subscribers, 1000 topics, rising rate |
s2-payload | 20000 msg/s inbound, QoS 1, sizes 128 B, 1 KiB, 4 KiB, 8 KiB |
s3-fanin | 2000 publishers, 100 subscribers in 20 shared groups of 5, QoS 1 |
s3-fanout | 10 publishers, 2000 subscribers, 200 per topic, QoS 1 |
How to run the suite
Set the generator settings first. The suite has no default. A full run takes many hours. Short runs diagnose only and never count as results.
# Needs Linux, Docker, and 10 or more permitted cores. The example test does not run it.export LOADGEN_IMAGE=<generator-image>export LOADGEN_BIN=<generator-binary>bash benchmark/suite/build-probe.shbash benchmark/suite/run_all.sh <source-dir> <commit-label> /tmp/bench-outRun the unit tests of the suite:
# Needs the suite directory. The example test does not run it.cd benchmark/suite && python3 -m unittestHow to read the report
run_all.sh writes one directory with <scenario>.jsonl (one line per step), <scenario>.csv, <scenario>.summary.json, all-scenarios.csv, env.json, and report.html. Open report.html for the page. Read env.json for CPU, memory, OS, and core split.
- The recommended load is the step with CPU nearest 75 percent. Steps with a limit flag or delivery below 90 percent do not count.
- A step with flag
generator_limitedshows a generator limit, not a broker limit. Do not use it for a broker claim. delivery_ratiois delivered messages divided by received messages times the fan-out.- Limits of the method: each step runs once, the generator shares the machine with the broker, the probe adds 1000 msg/s that the suite subtracts, and latency covers probe pairs only.
Rules for numbers
Quote a number only with its hardware, its scenario and its repeats. A figure that still rises at cutoff is “still rising at cutoff”, never final. Report the slow cases first.
Check that it works
Start the broker with this file. The health endpoint returns OK.
[node]id = "docs-benchmarks"
[listeners.tcp]bind = "0.0.0.0:1883"
[listeners.api]bind = "0.0.0.0:18083"
[logging]level = "warn"python3 - <<'PY'import os, socketport = int(os.environ.get("API_PORT", "18083"))sock = socket.create_connection(("127.0.0.1", port), timeout=5)sock.sendall(b"GET /healthz HTTP/1.0\r\nHost: docs\r\n\r\n")print(sock.makefile().read().strip().splitlines()[-1])PYOKNext steps
- Size a host in Sizing.
- Read the full method in
benchmark/suite/README.md.